Comment pouvons-nous vous aider ?
“OKR” dashboard
OKR definition
« OKR » stands for “Objective Key result”. is a performance management system that has been popularised by the big Silicon Valley start-ups. They are used to align and guide teams towards the organisation’s priorities, to monitor progress and to ensure that everyone is working together towards the same goals every day. OKRs are made up of a main objective and several key results.
OKRs are often defined at a high level within the company and, ideally, at team or individual level. They are defined for a given period, such as a quarter or a year, and are reviewed periodically to ensure that the company is on track to achieve its objectives.
OKR in Perfony
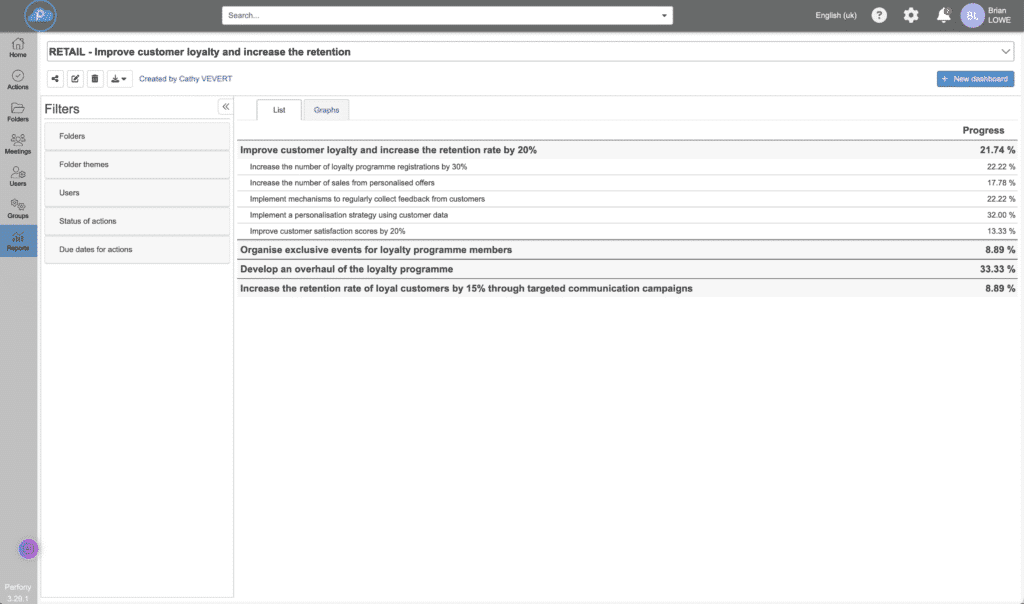
An OKR is made up of a Main Objective and several Key Results. The “OKR” dashboard will enable several actions (key results) to be aggregated. This aggregation becomes the Main Objective. Progress in achieving the Objective is calculated from the progress of the actions that make it up. The “OKR” dashboard will allow you to build, display and manage your OKRs.
Your OKRs in Perfony will be available and updated automatically in the form of lists and graphs.

Rights and access
- The configuration of an OKR dashboard is available from the “Pilot” licence.
- Viewing an OKR dashboard is available for all licence levels.
Source data
The data in your OKR dashboard are the actions contained in the folders to which you have access. They may be actions or sub-actions. Before building an OKR dashboard, it is therefore advisable to have formalised the actions in all the relevant folders.
Tip: for identical actions that need to be duplicated in several folders and for which you want to monitor overall progress, it is a good idea to create a “directory” or “toolbox” folder in which you can create your standard actions. Then simply duplicate them by clicking in the required folders. This ensures that the right actions are duplicated in the right places in the shortest possible time.
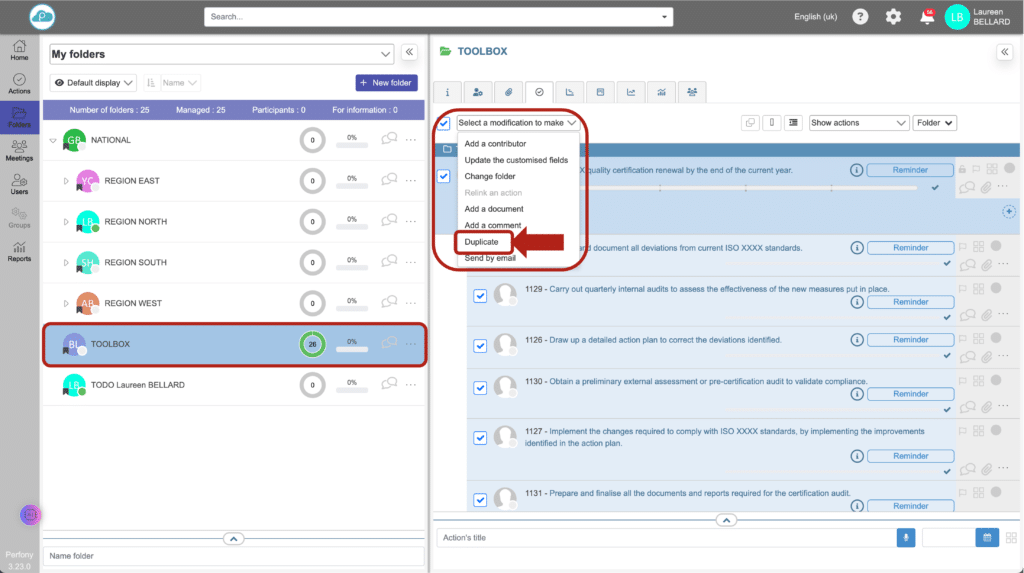
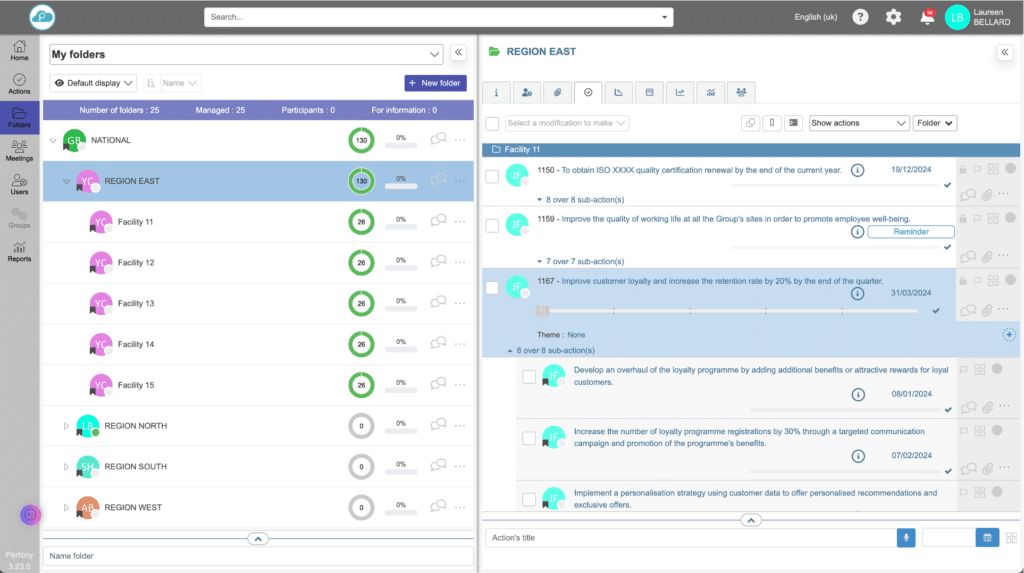
Once your actions have been duplicated, you can assign a manager to each folder and adjust the lead times to obtain a database of actions tailored to each site:
Create an OKR dashboard
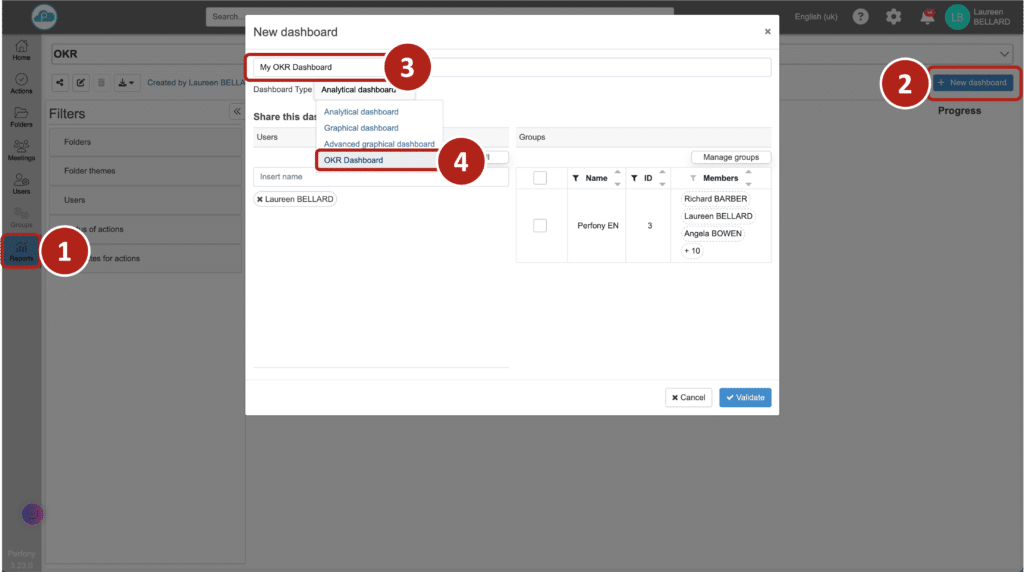
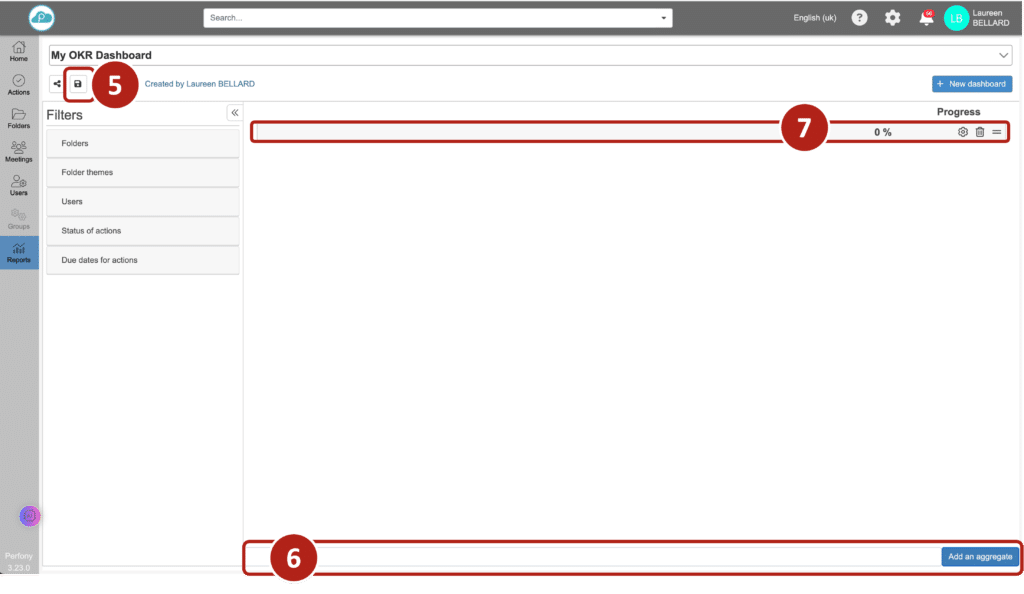
From the “Reports” menu click on “New dashboard . Enter a name for your dashboard and select the “OKR” dashboard type from the drop-down menu .
Configuring the OKR dashboard
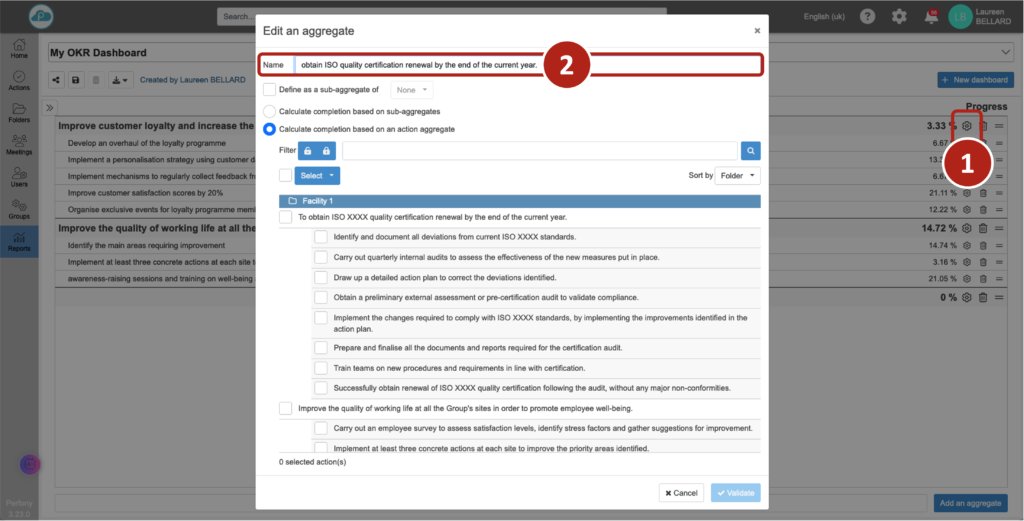
Cette ligne va être un ensemble d’action, il convient maintenant de configurer. Clicking on the configuration button opens a popup window.
The first thing is to give your aggregate a name. In the “name” field , enter the desired label. This is the name that will appear on the dashboard.
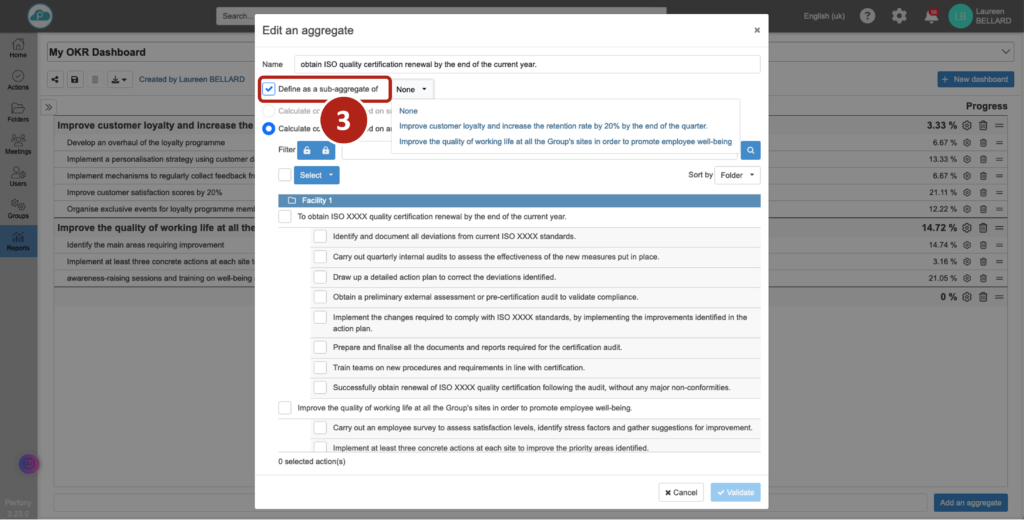
If the aggregate is not a sub-aggregate, you can choose how you want to calculate its progress : either on the basis of the progress of the sub-aggregates, or on the basis of the progress of the actions.
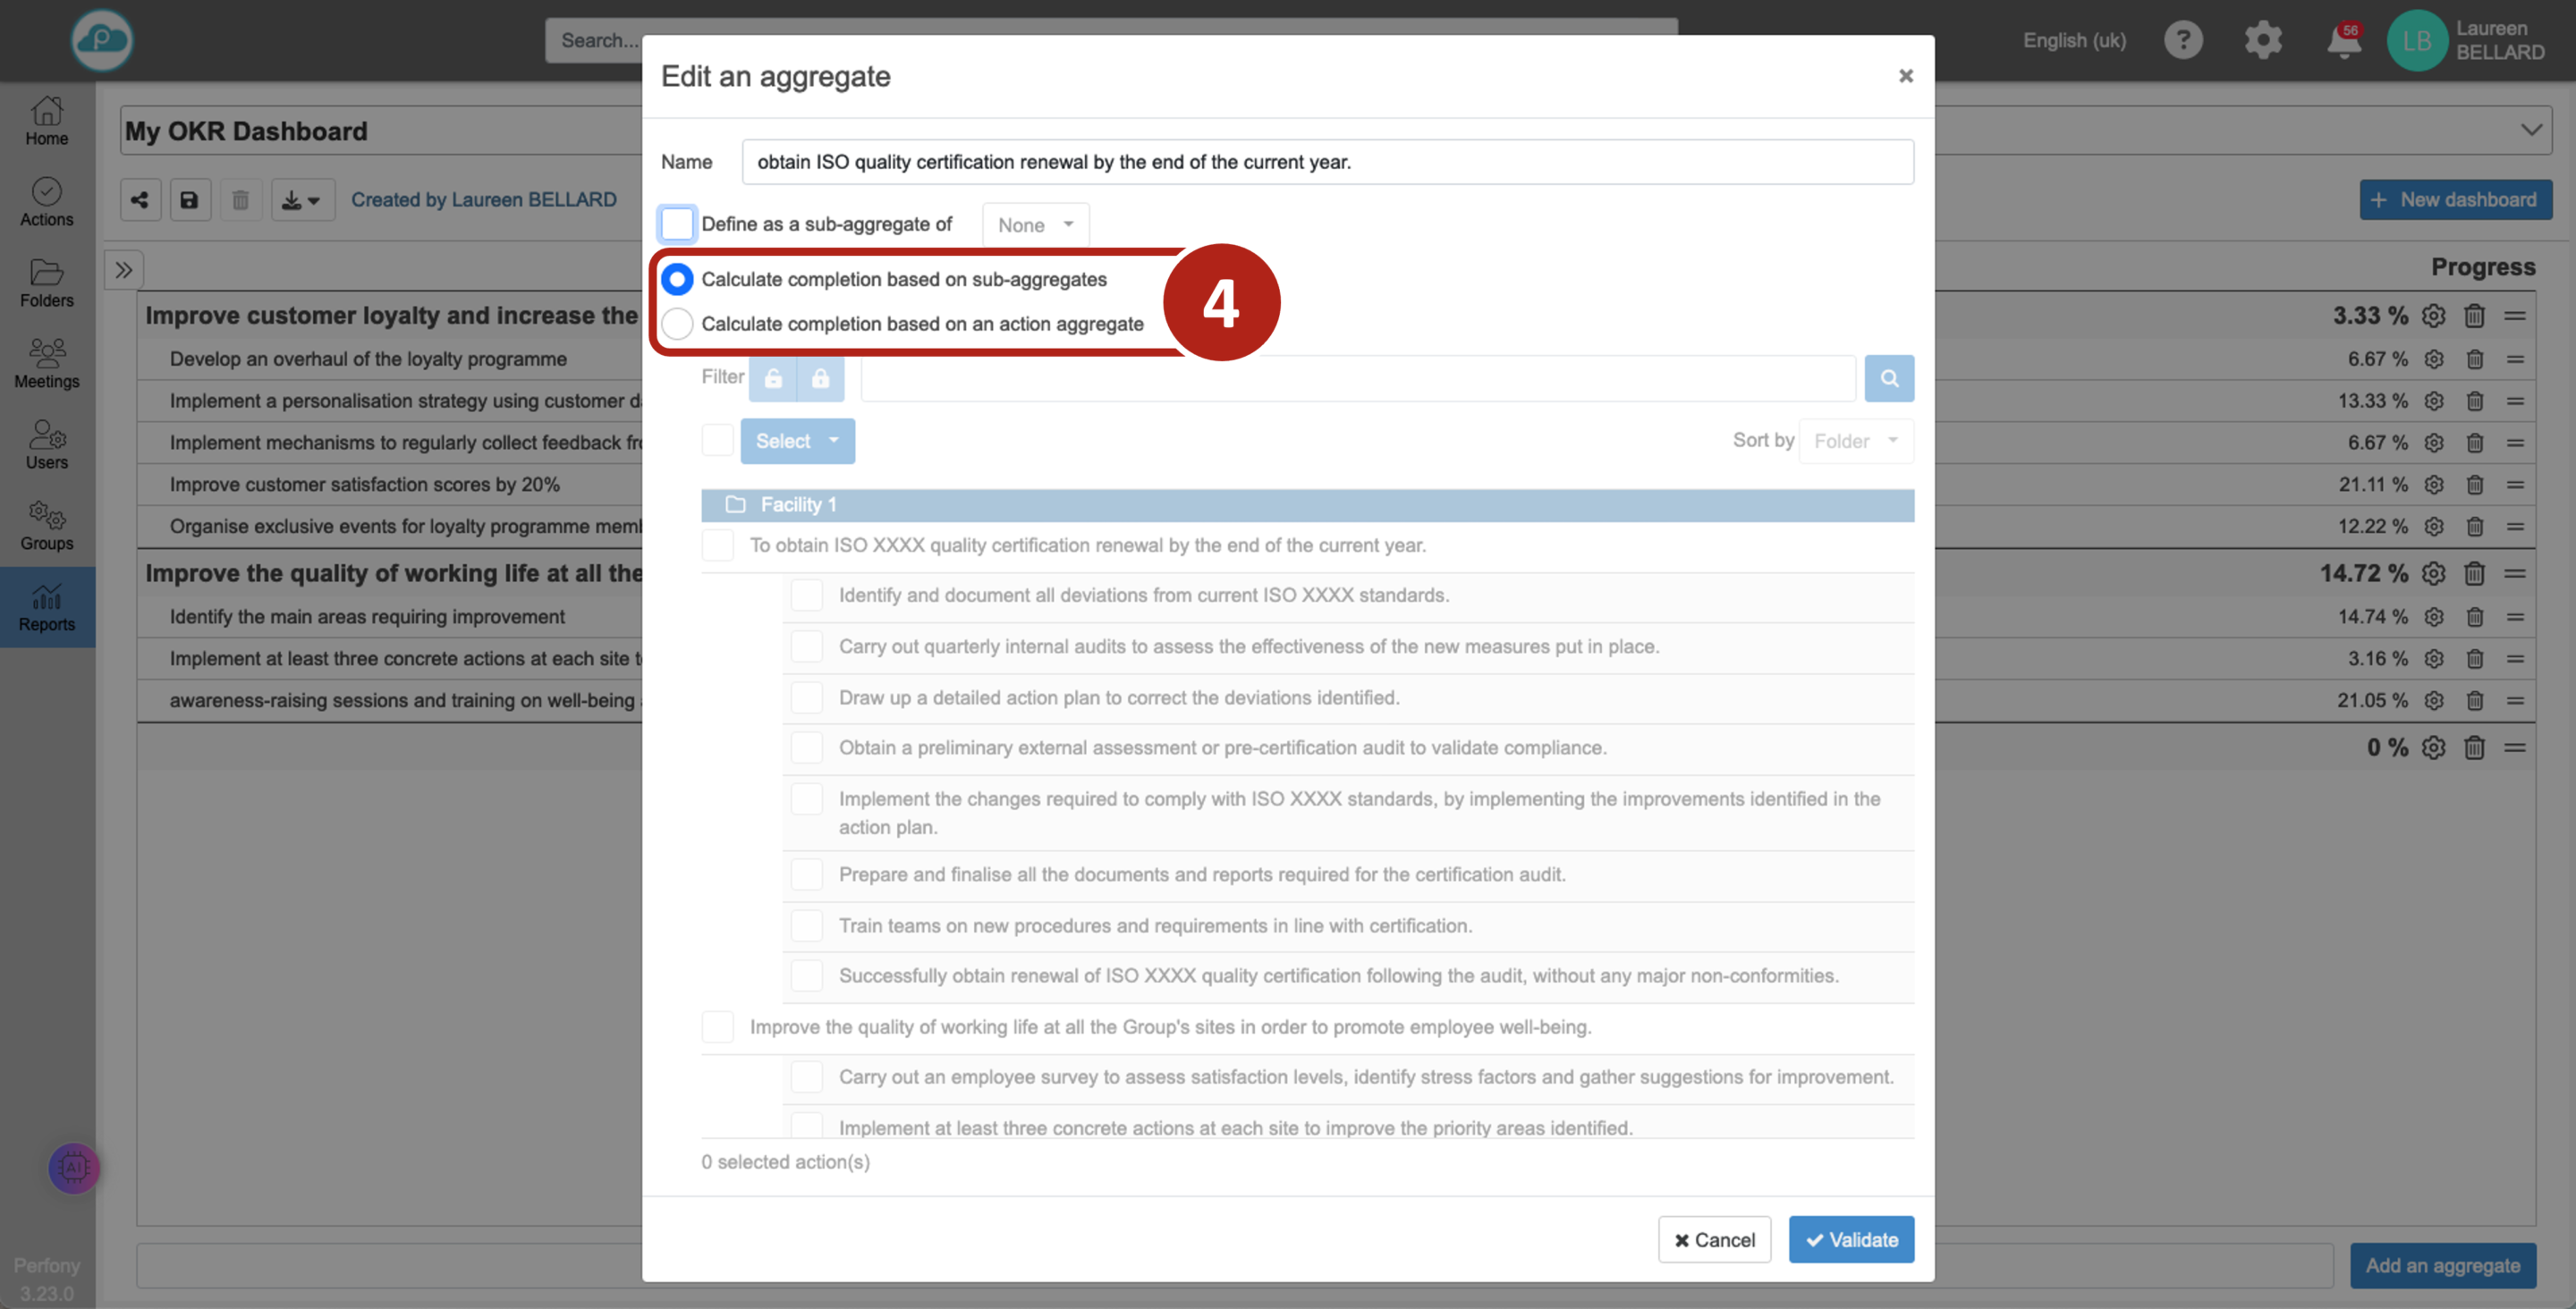
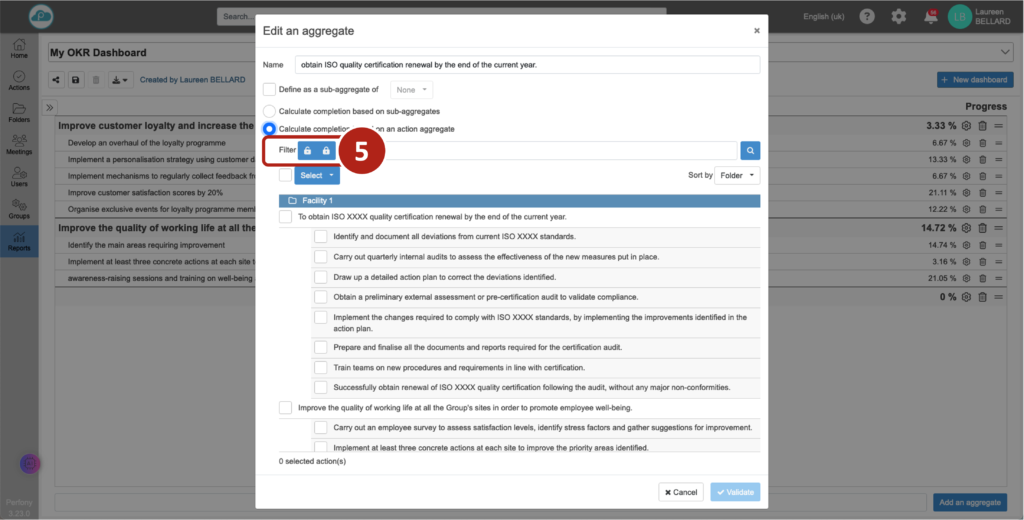
If the aggregate is calculated according to the progress of the actions, we can now select them. All the actions in the folders to which we have access are displayed. You can choose to restrict the display by filtering the actions according to their locking level (understand the action locking function).
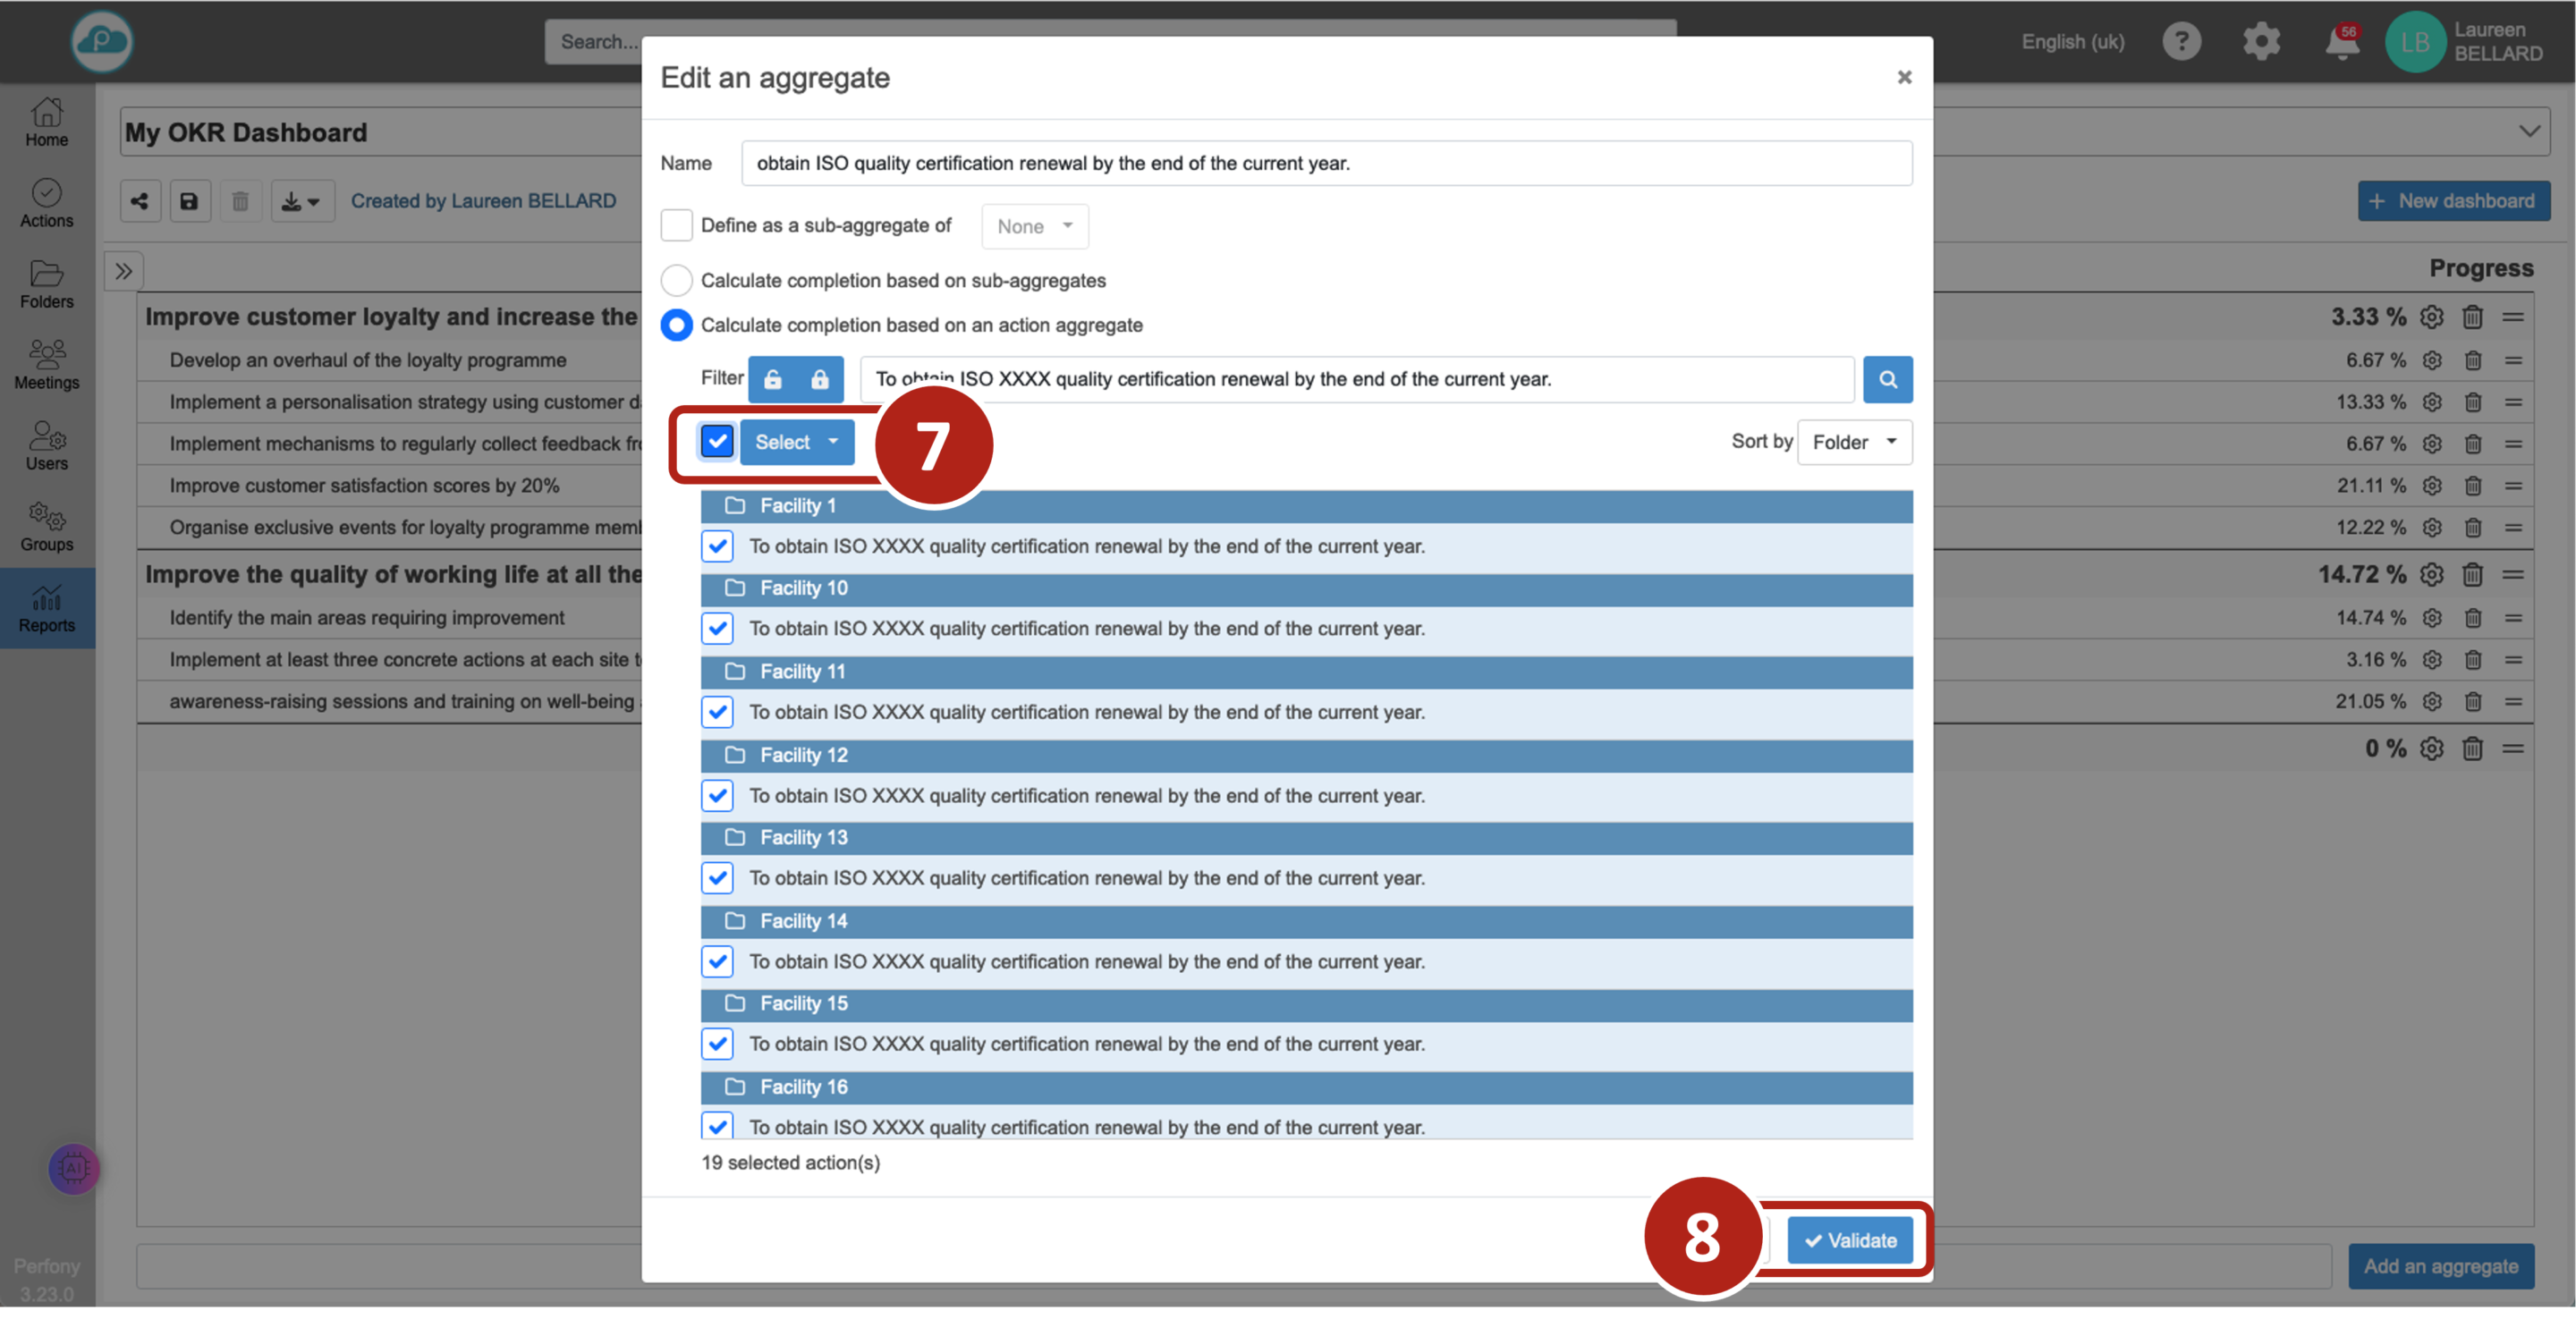
You can choose to select the desired actions one by one.
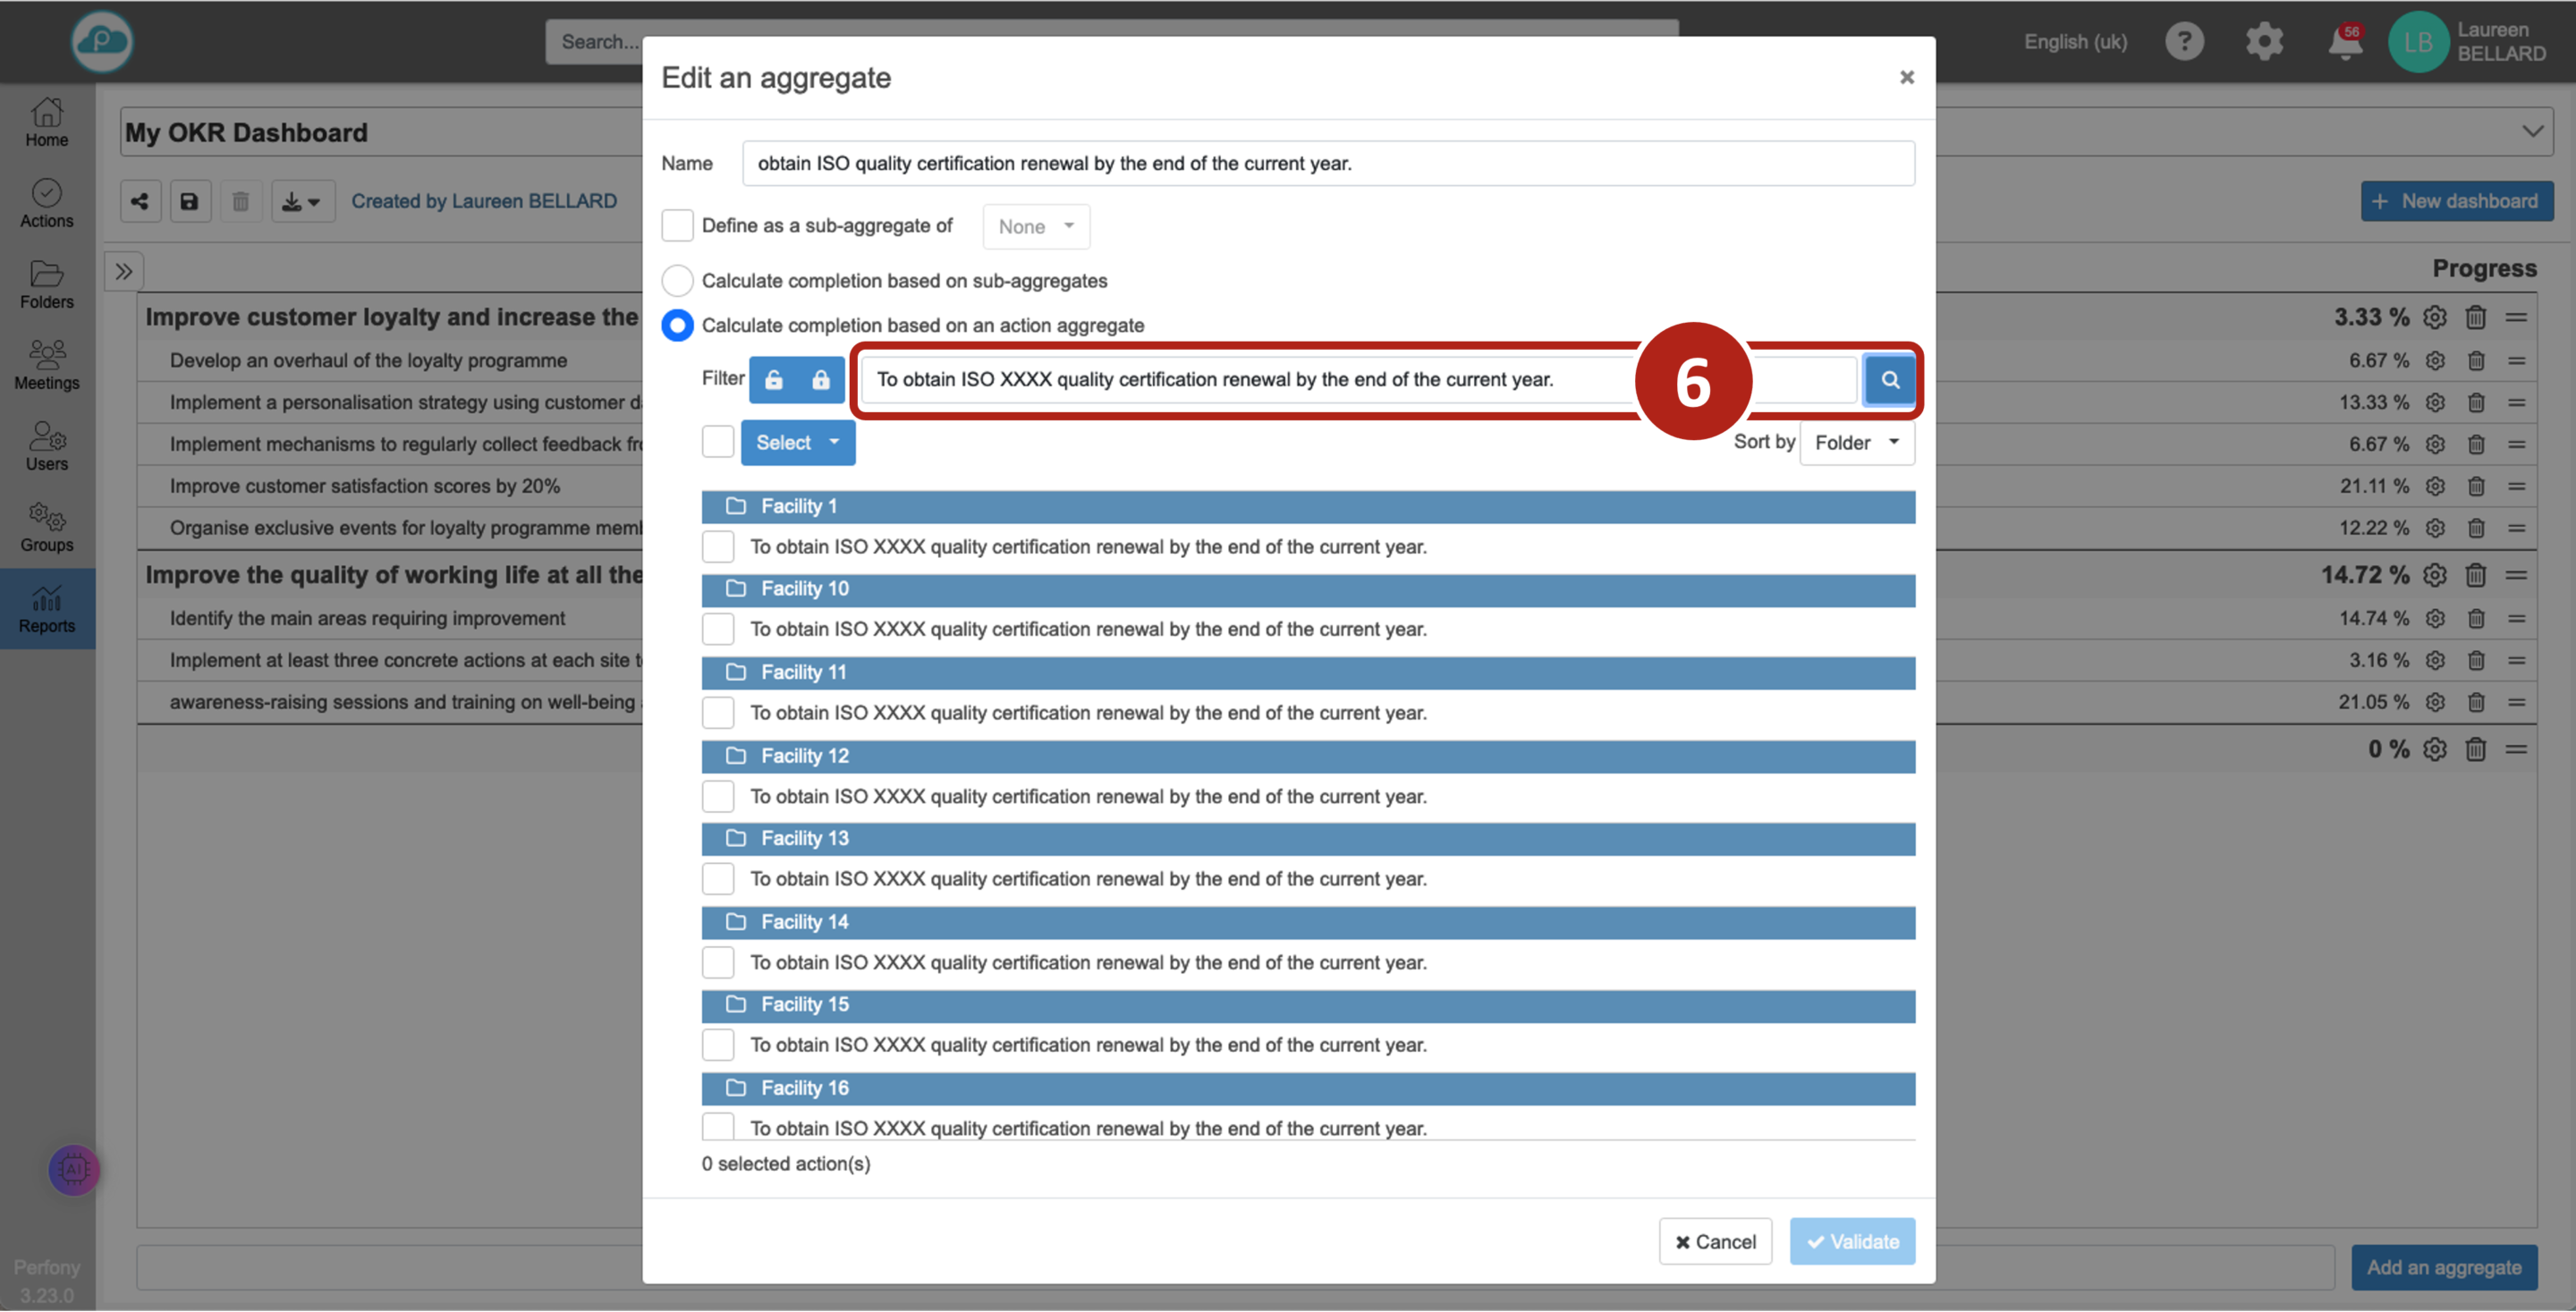
If an identical action is duplicated in several folders, you can make a multiple selection using a search by name: copy/paste the name of the action into the search box and click on the magnifying glass. All actions with strictly the same name will be displayed.
Tip 1 : Every character counts in the search for action. If the search for an action following copy/paste does not produce any results, it is very likely that an extra space has been removed during copying. just add it in the right place.
Tip 2: If the folder template displays the action ID, it will appear in the list of actions in the popup. To search for an action, copy only the action name and not the ID (which is unique).
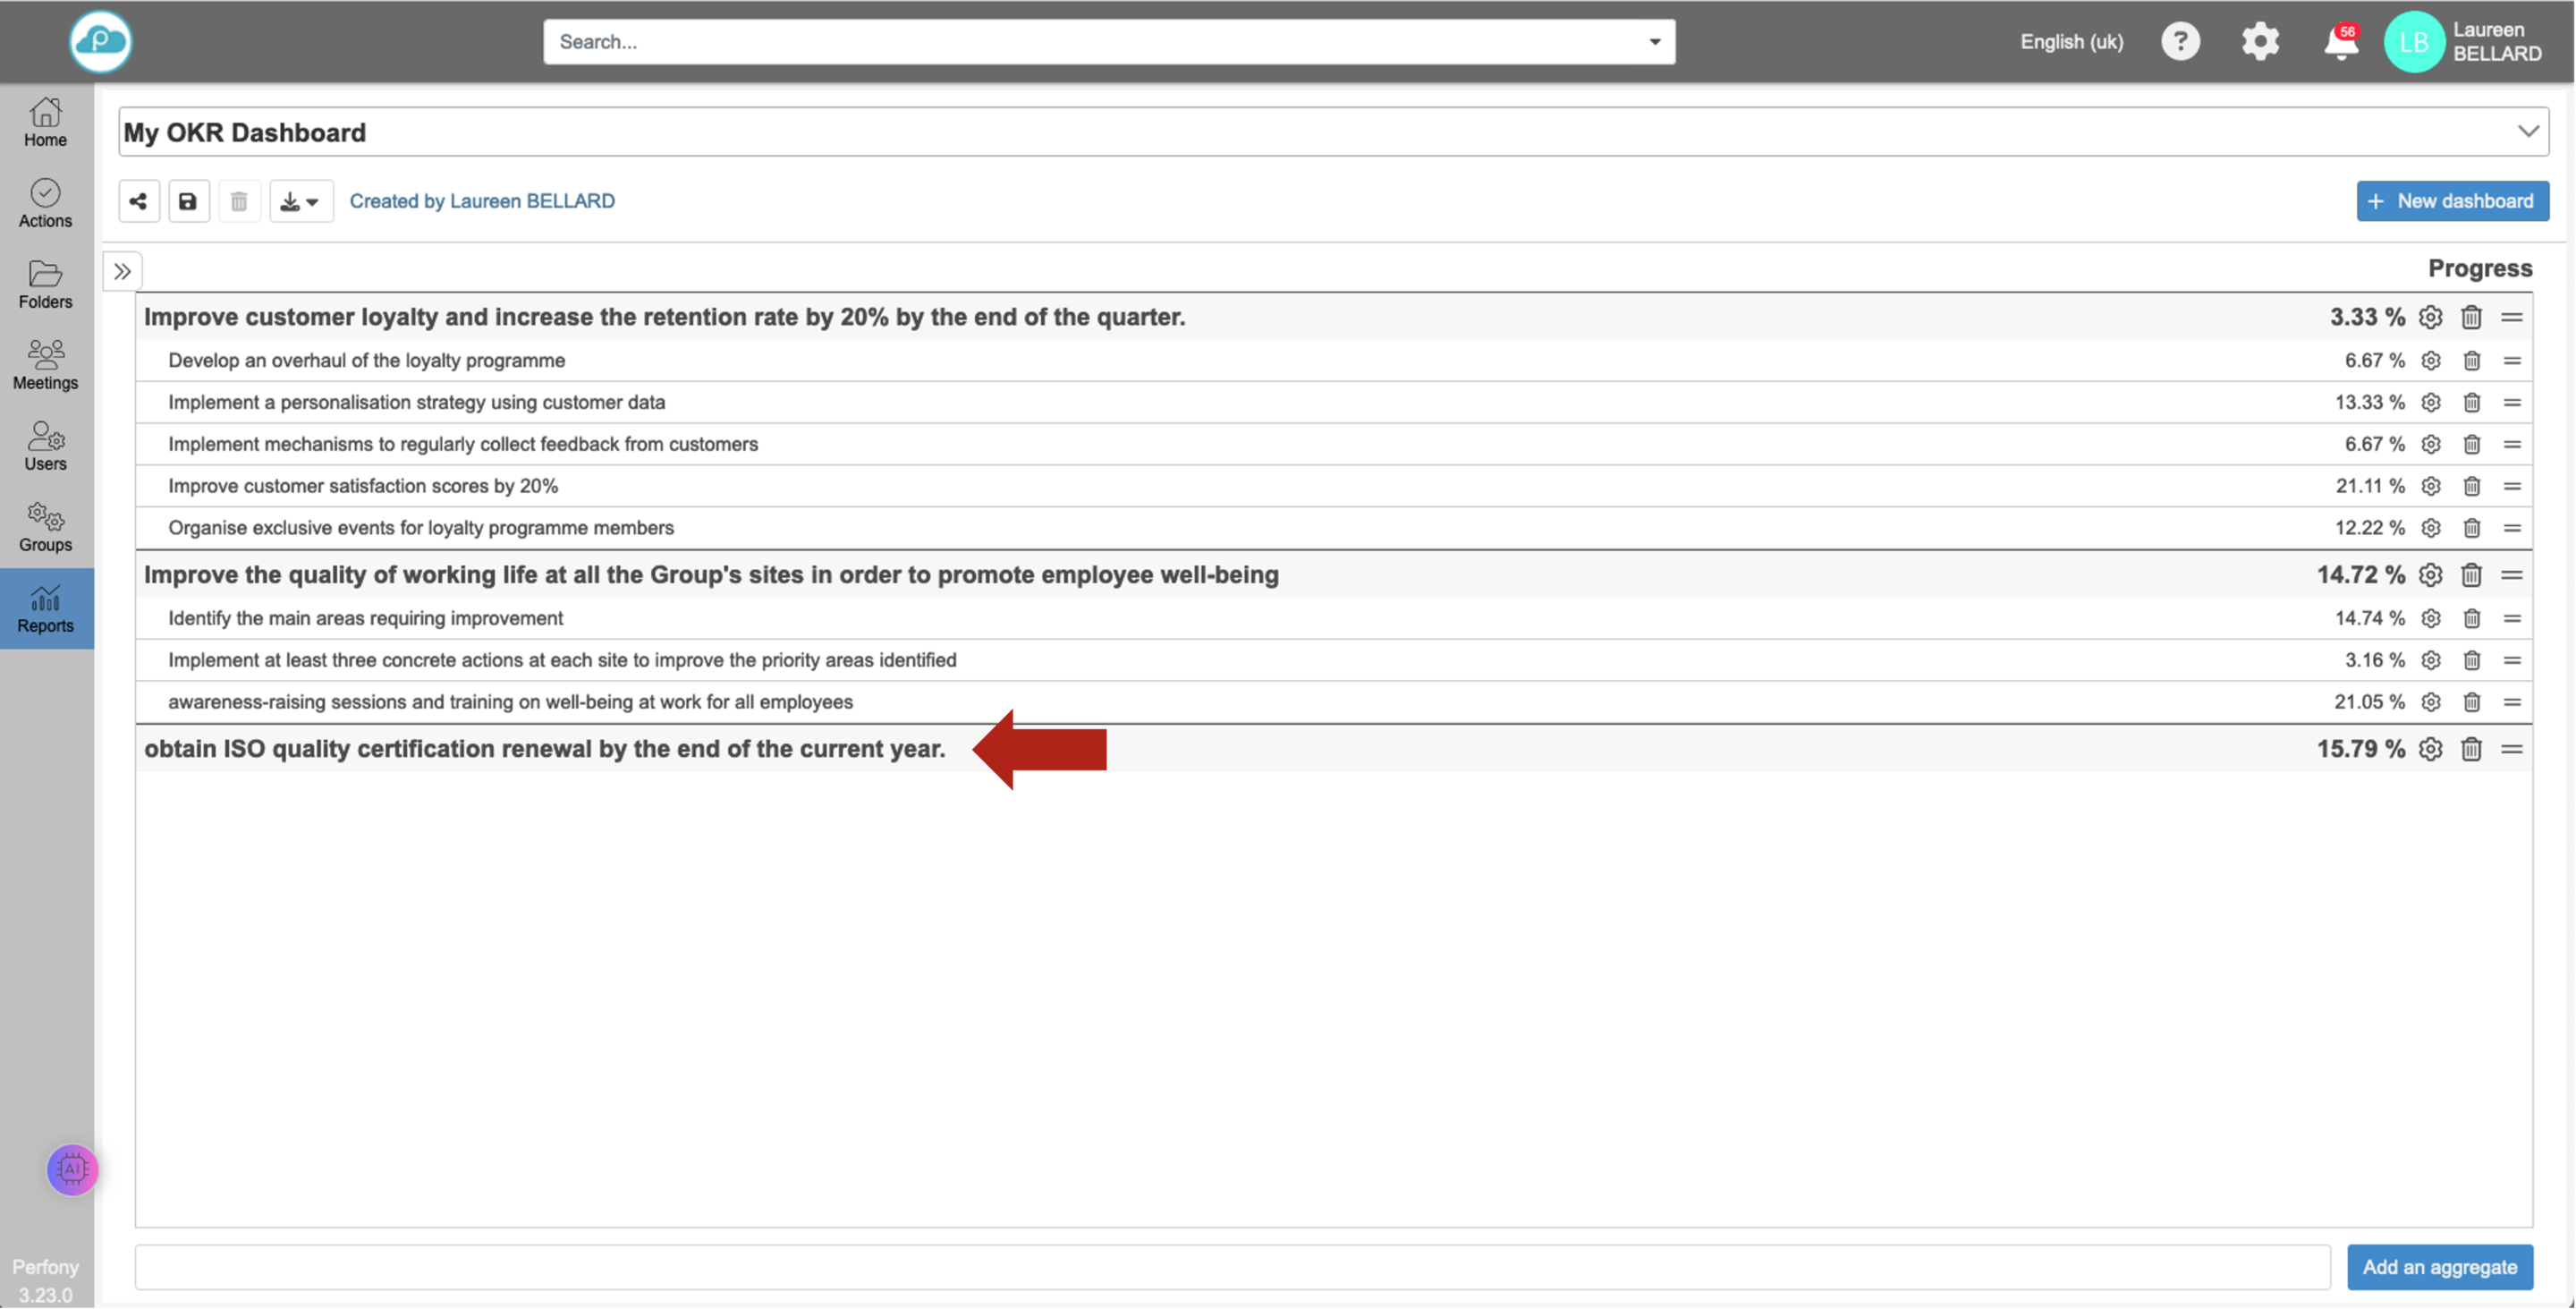
Click on validate and the line is created in the dashboard.
How aggregates are calculated
The result depends on whether an action and its sub-actions have been selected, and on whether the aggregate has been calculated on the basis of sub-aggregates or on the basis of a set of actions.
For example:
Recording and editing mode
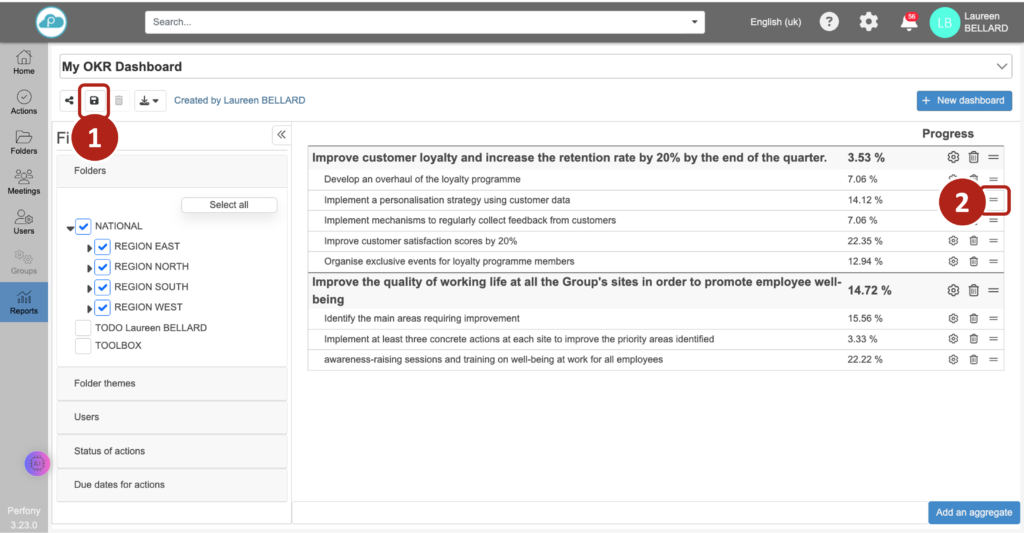
To make changes to your OKR dashboard, click on the edit button.
- In edit mode, the configuration button at the end of the aggregate line can be used to make changes.
- You can also delete an aggregate Caution! any deletion is permanent.
- You can also customise the order in which your aggregates and sub-aggregates are displayed using drag & drop from the icon .
Once you have made your changes, remember to click on the edit button to save and exit edit mode. Don’t worry, if you have to leave the page without saving, an alert will warn you and ask you to save your changes before leaving the page for good.
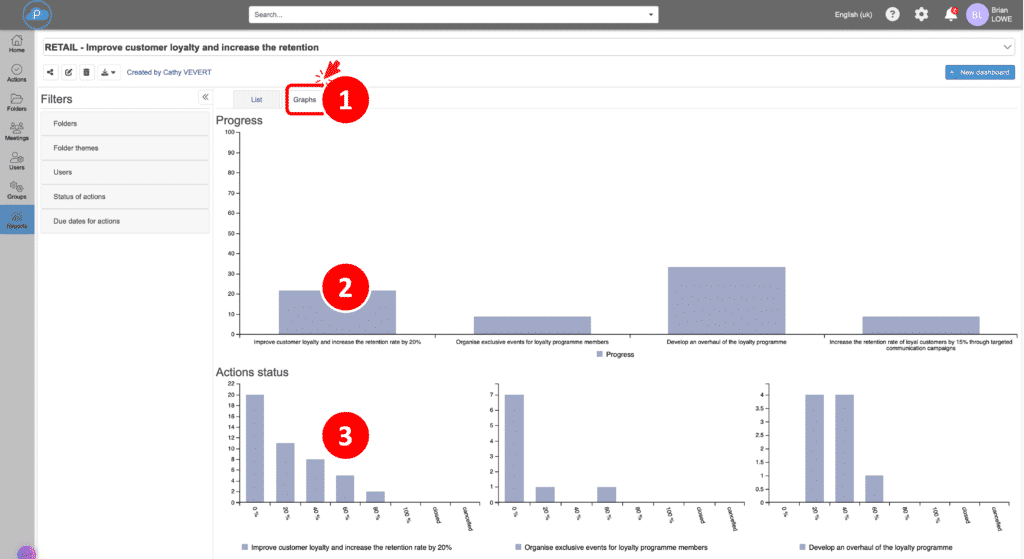
Graphical representation of an OKR
Every OKR dashboard has two tabs: a “list” tab for a list of aggregates and sub-aggregates, and a “graph” tab. which automatically displays a visual representation of the progress (%) of a main aggregate, without the need for any configuration and a breakdown of the progress of its component actions
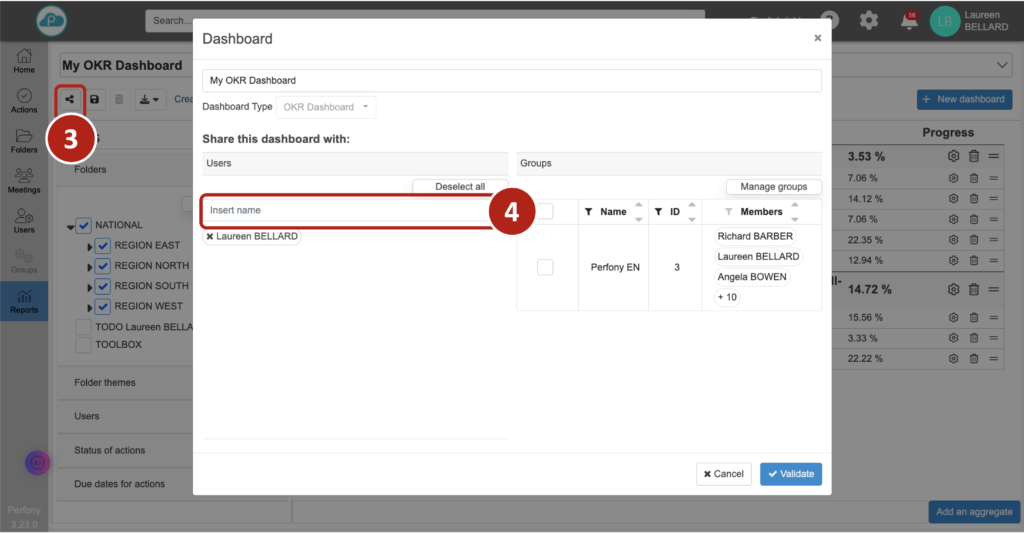
Share your OKR Dashboard
The share icon opens a popup to enter (or delete) the names of the users with whom you want to share the dashboard, or select a group already configured in the “Groups” menu.
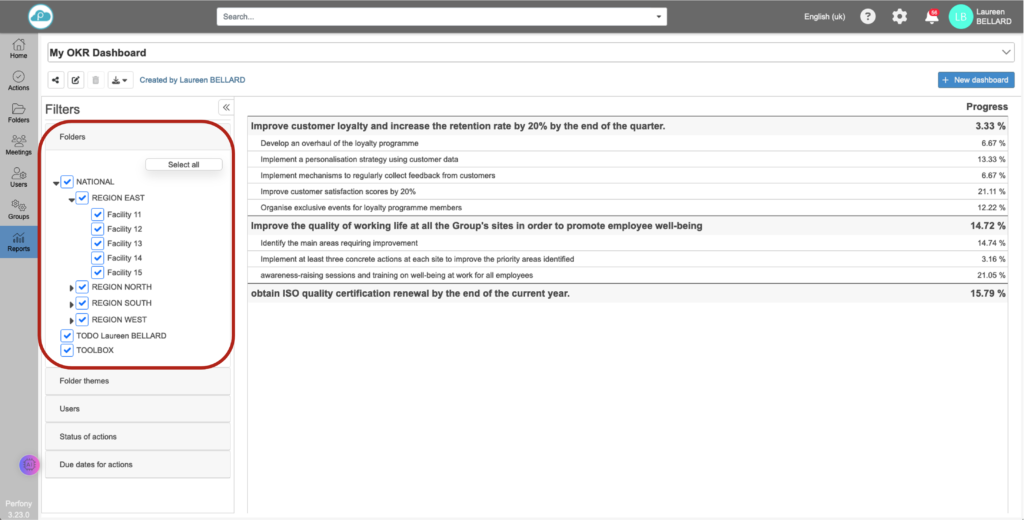
Filter the data on your OKR dashboard
The left-hand side of your dashboard displays various filters. The folder section is where you can update the dashboard with the selected folders.
Each user with access to the dashboard will be able to update it according to their choices. This display is personal and will not change the display of other users who have access to the dashboard.
Note that each user who has access to the dashboard will only see the part of the folders they are in. Data confidentiality is respected, everyone stays at their own level, and with the same dashboard, you can have a global view if you are in all the folders, or a field view if you are only in one of the folders.
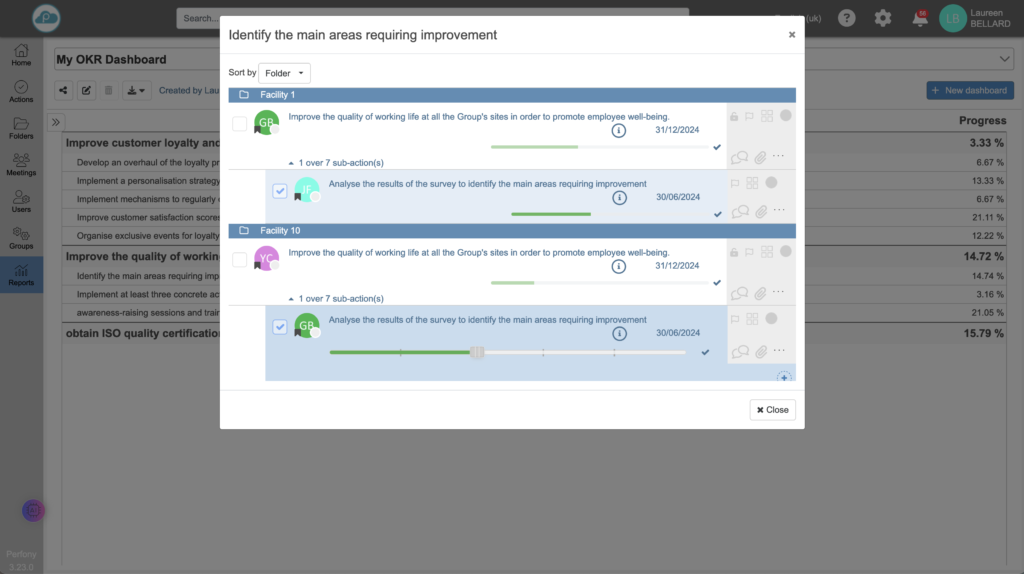
To see the details of an aggregate, simply click on its name in the dashboard, and the list of actions that make it up will appear, allowing you to analyse the results folder by folder.
View OKR actions
Clicking on the line or graph in question displays the actions that make up the aggregate. Actions can then be controlled and updated directly from this window.
If we select an action (A) and its 4 sub-actions (SA1, SA2, SA3 and SA4), each action is considered individually: