Comment pouvons-nous vous aider ?
Graphical dashboard
The graphical dashboard lets you create and share visual representations of the data contained in the actions in your files.
Rights and Access:
“Pilot” rights are required to create and edit an analytical dashboard.
Other users can see it in their “Report” menu once it has been shared with them.
Creation:
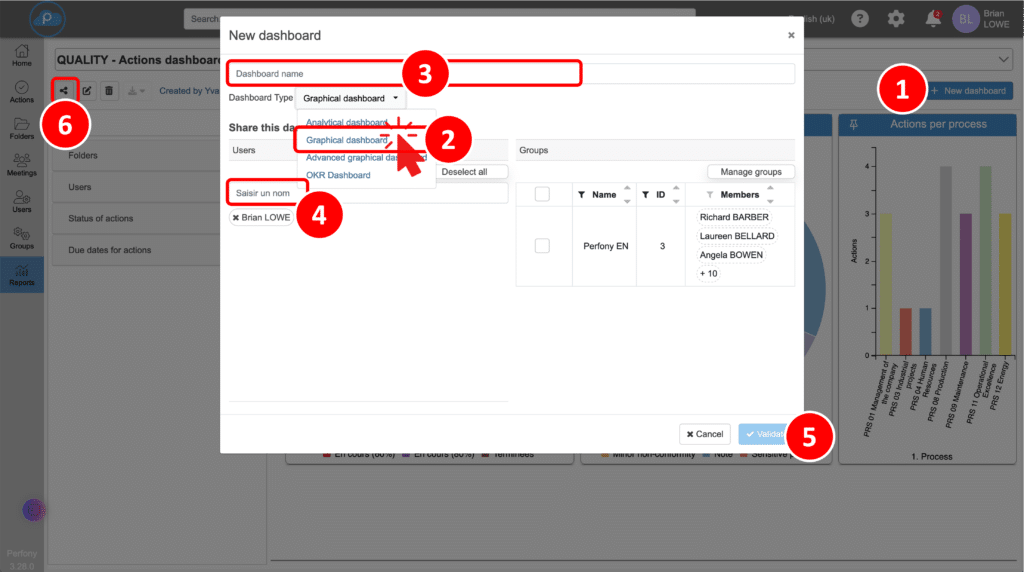
- Click on “New Dashboard”
- Select the “Graphical Dashboard” type
- Give your dashboard a name, which will appear in the drop-down menu
- Specify the users with whom you wish to share your read-only dashboard
- Validate your creation
Tips and tricks:
You can always change the name and users with whom you share the dashboard by clicking on the share icon at any time
Editing and Modifying the Dashboard
Once your dashboard has been validated, you can start filling it in. The next time you log in, access your dashboard from the “Reports” menu and the drop-down menu.
Here’s what you can do:
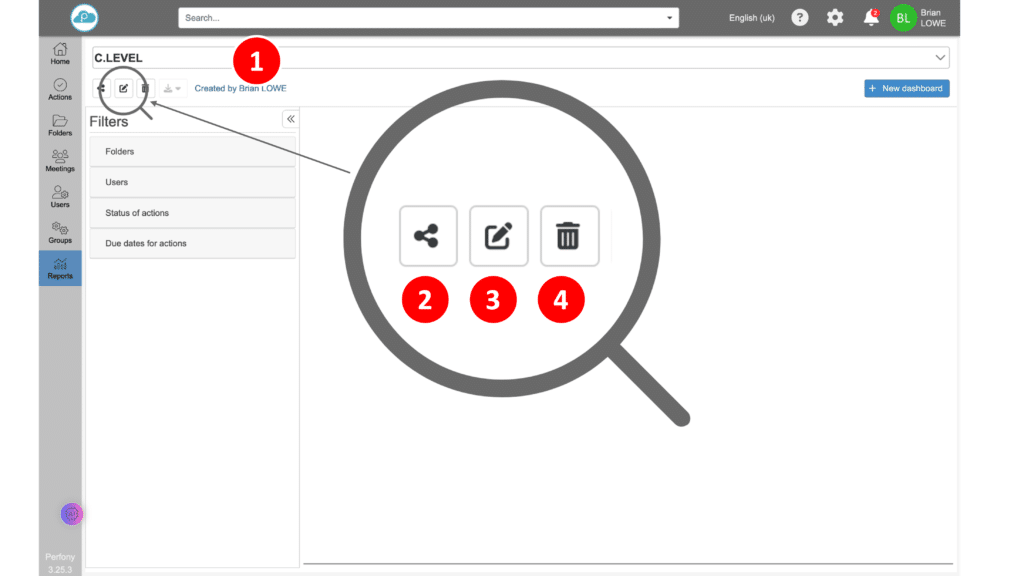
- Change name: You can change the name of the dashboard at any time.
- Share: Choose the users to whom you wish to give read-only access to this dashboard.
- Editing and saving changes: To make content or configuration changes, click on “Edit”. Remember to save your changes by clicking on the icon again. Make sure you switch back to reading mode before leaving the page.
- Deleting a Dashboard: Please note that any deletion is permanent. Before deleting your dashboard, please consider the following points
Using Filters on the Dashboard
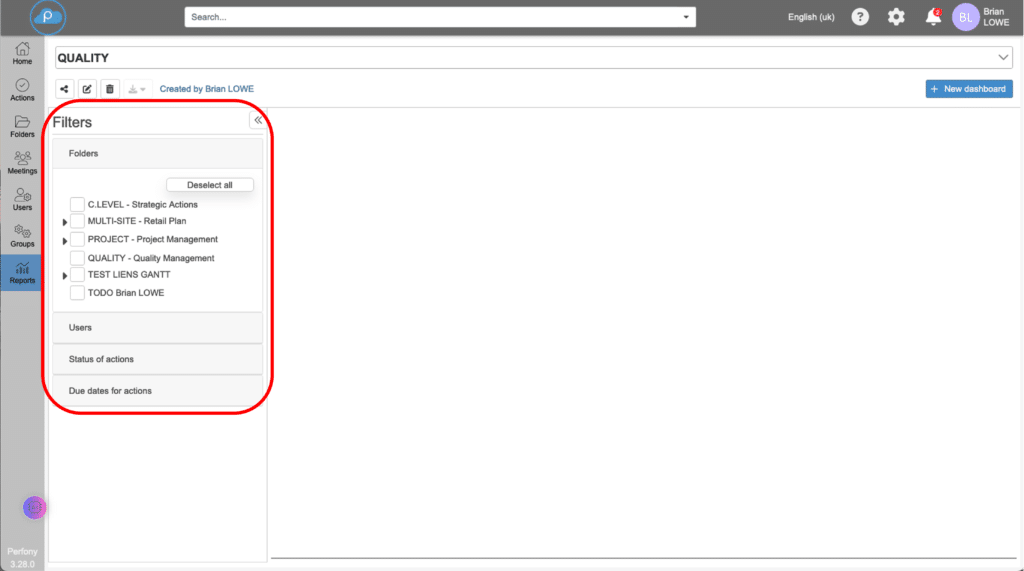
Before you start creating graphs, understand how to use the filters on the graphical dashboard.
Access to Filters: Filters are accessible via a dedicated area on the left of your dashboard. You can fold it up or display it as required.
Activating filters: You don’t need to be in edit mode to use filters. However, to save your changes, switch to edit mode and save them.
Filter functions: Filters automatically update all the graphs on your dashboard. They act on the whole picture. If you want to display graphs based on different data, create an advanced graphical dashboard.
Selecting data sources: To begin with, select the folders to be used as data sources for the graphics. You can then refine the graphs using user filters, which highlight the actions for which they are responsible, as well as the status and expected completion date of the actions, to obtain an up-to-date dashboard.
Graphics configuration
Now that you’ve created your dashboard, you can add graphs to it.
Step 1: Selecting the Block Type:
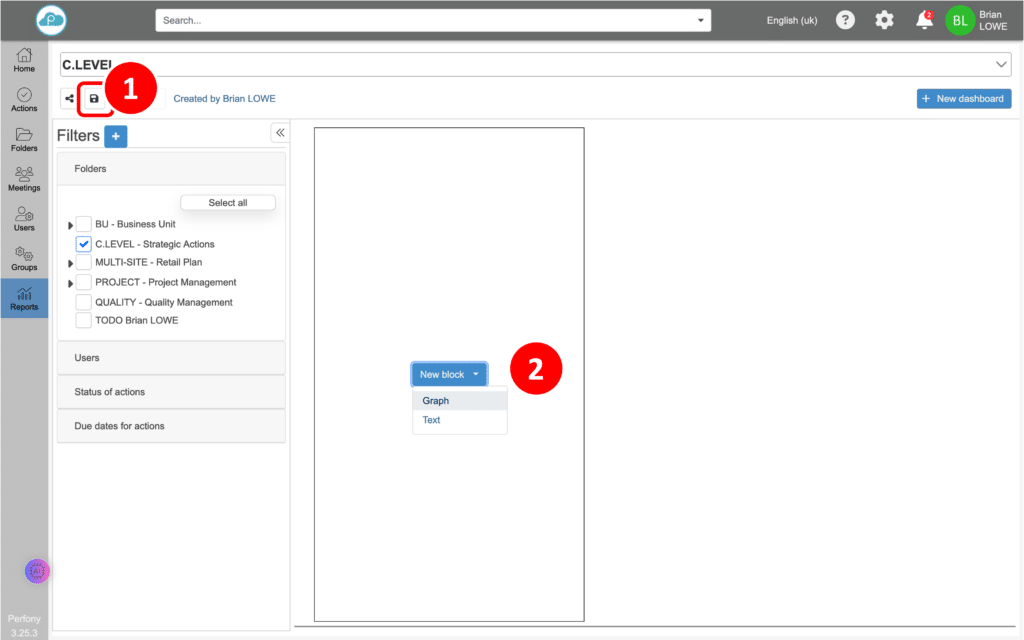
Select your dashboard and switch to edit mode by clicking on the “Edit” icon
A creation zone will appear. You can choose between a graphic or a text box to add content
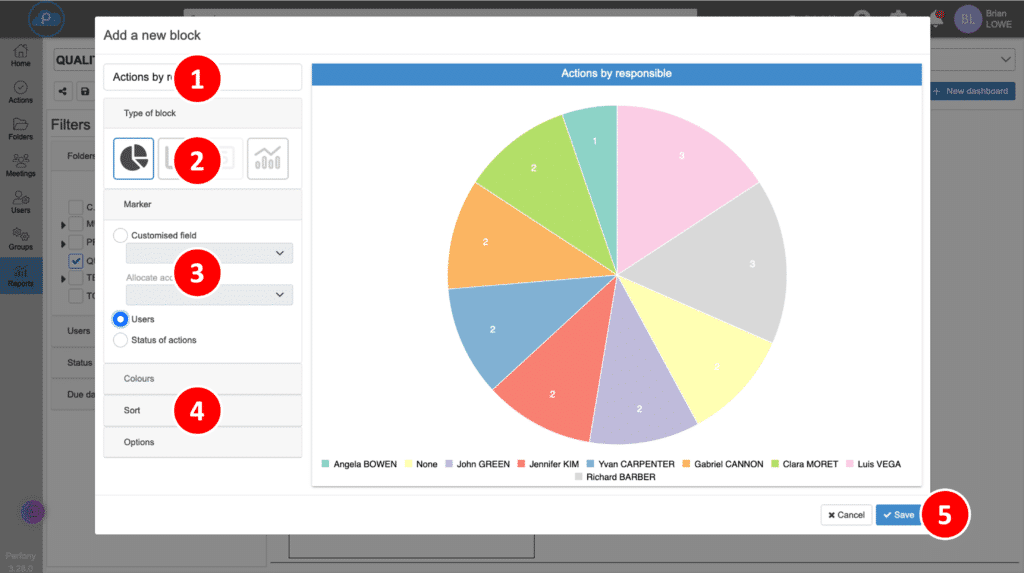
Step 2: Creating the graphic:
Click on “Graph” to open a pop-up window.
Give your graph a name
Choose the type of graph
Select the variable to be displayed
Customise colours and display options if required
Save your chart
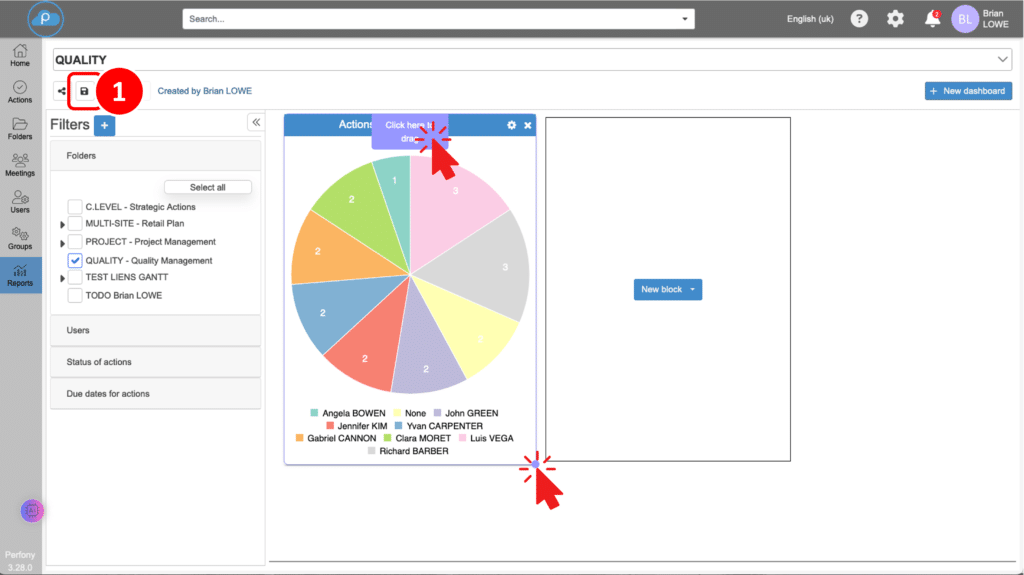
Step 3: Adjusting the graph:
You can resize the graph by selecting the dot at the bottom right and move it around your dashboard as required.
Tip:
Don’t forget to save your changes by clicking on the edit button again before exiting.
Types of graphics
There are 4 different types of graphics:
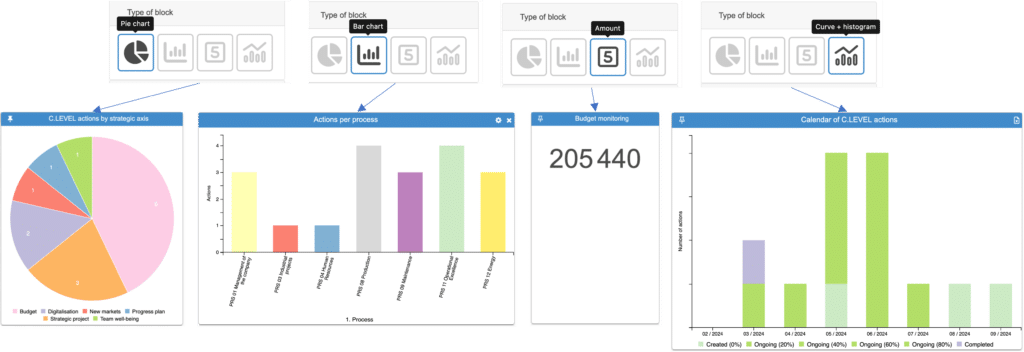
Pie chart: Displays the proportions of the different categories.
Bar Chart: Represents data in the form of vertical bars.
Amount: Displays the sum of the numeric custom fields in your actions. Requires a folder template with a numeric custom field.
Combo: Allows you to combine several variables and mix bar and line charts on a calendar basis.
Configuring a combinatorial graph
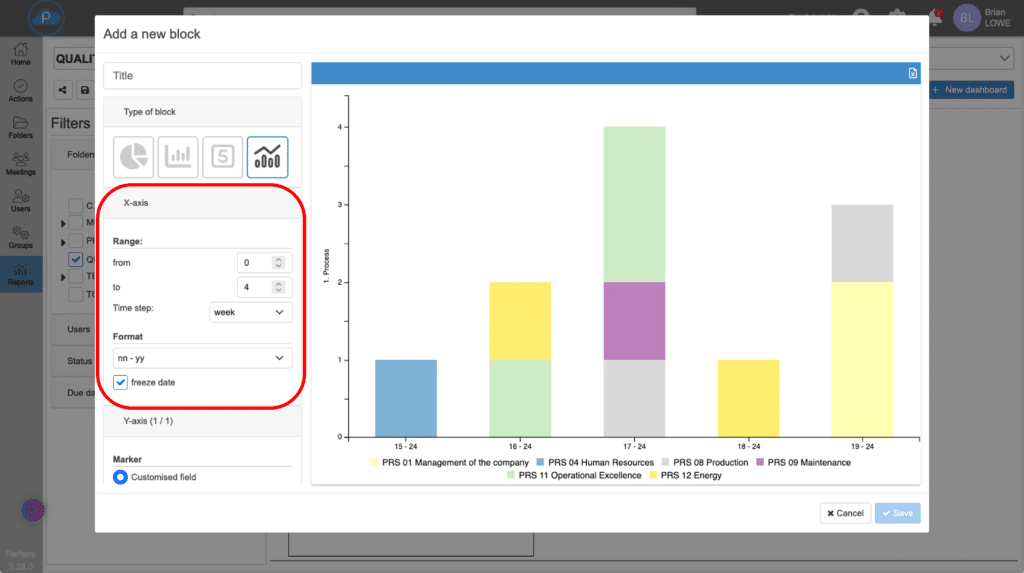
Step 1: Format the X axis
Determine the time step (week, month or year) for the x-axis. You can freeze it or leave it floating.
Step 2: Format the Y axis (Y1)
Select a custom field from the drop-down menu for the y-axis. Customise the diagram type, colours and legend.
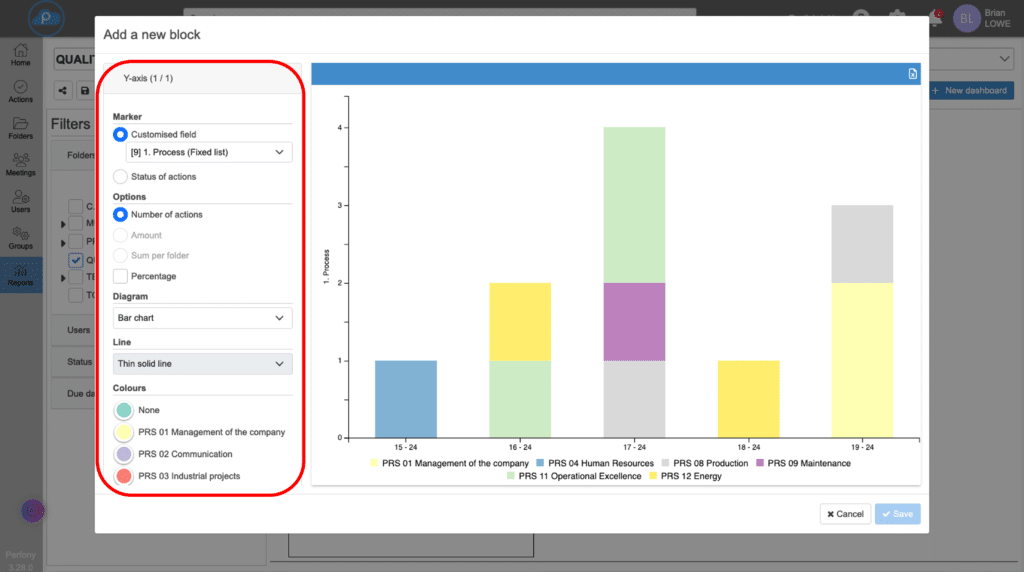
Step 3: Add an ordinate axis (Y2) if necessary
Step 4: Save
For more details on the possibilities offered by the dashboard, please refer to the “dashboard tips and tricks” page.