How can we help?
Analytical dashboard
Rights and access
You must have at least “Pilot” rights to create and edit an analytical dashboard. But all the other users will be able to see it in their small “report” as soon as the dashboard is shared with them.
Creation
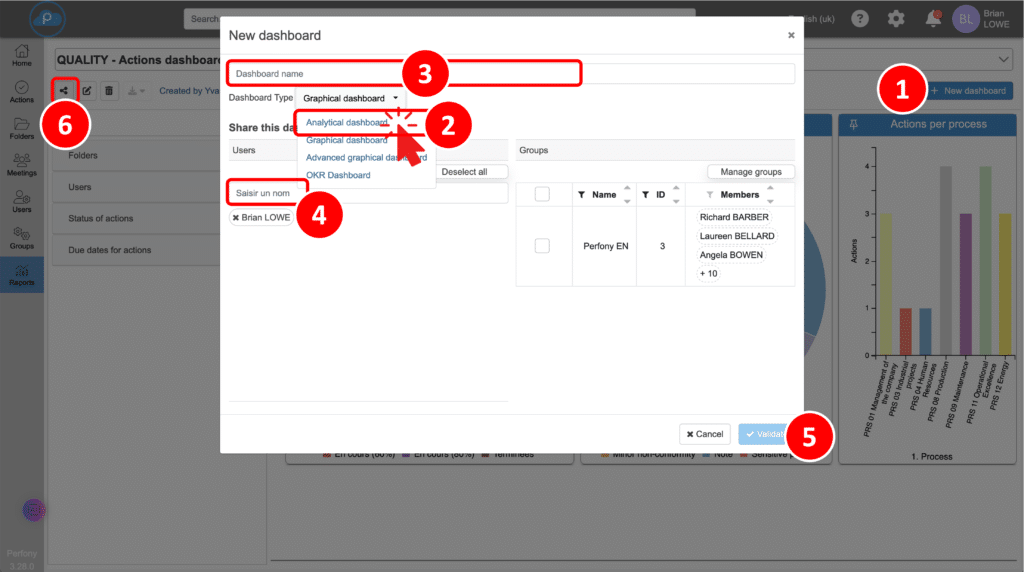
Click on “New dashboard”
Select the “analytical dashboard” type
Enter a name for your dashboard
You can also indicate with whom you wish to share this dashboard
Valider la création
Tips: you can always change the name and those with whom you share the dashboard at any time by clicking on the share icon.
Backup
You will now find your dashboard in the drop-down menu of the “Reports” menu.
As soon as you make a change to your dashboard, remember to save your changes so that you can find them the next time you log on.
Configuration
You can now select the data you wish to analyse. The principle of this dashboard is to display a cascade of information starting from the file and successively displaying the breakdown of actions according to progress status and customised field values.
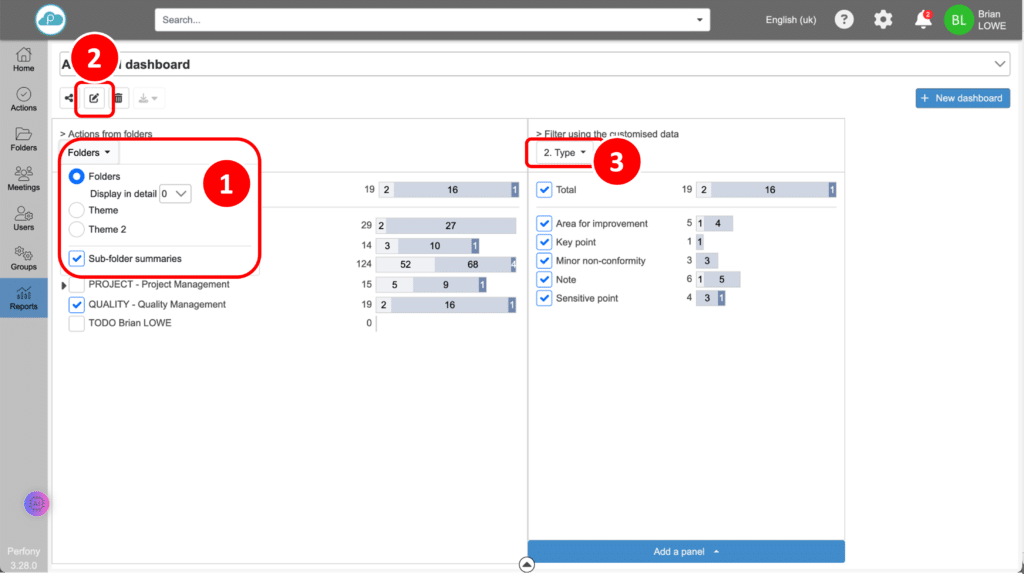
Select the data to be analysed:
- You can select the display depth, folder themes and activate sub-folder summation.
- Custom fields for your folder actions are displayed in the following panes.
- You can add panes to refine your search.
- You can display a “Folders” column to see the distribution of actions.
- Use the filter box to select the values to be displayed.
The left flap always takes precedence over the right flap.
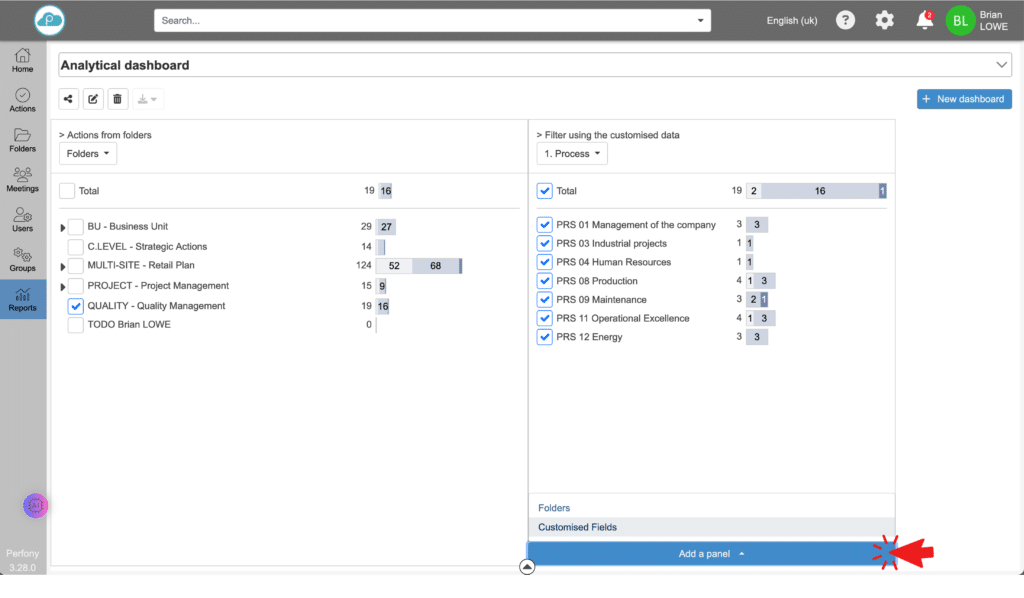
You can refine your search by adding as many panes as you like via the “Add a pane” button (this button is visible when you fold the legend via the central arrow at the bottom of the dashboard).
Central arrow at the bottom of the dashboard
The arrow at the bottom of the screen shows or hides a filter zone where you can choose the values you want to display.
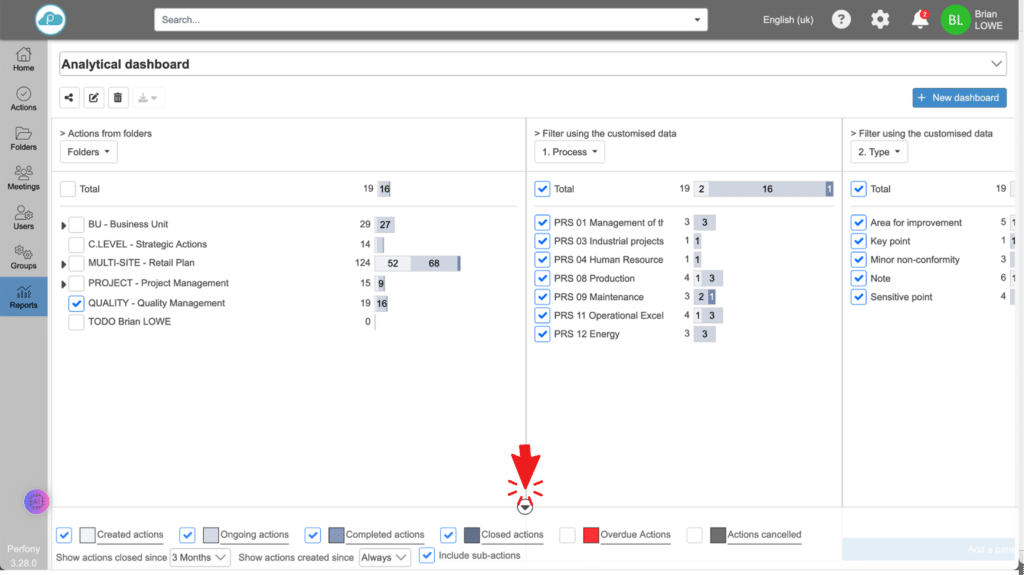
Example
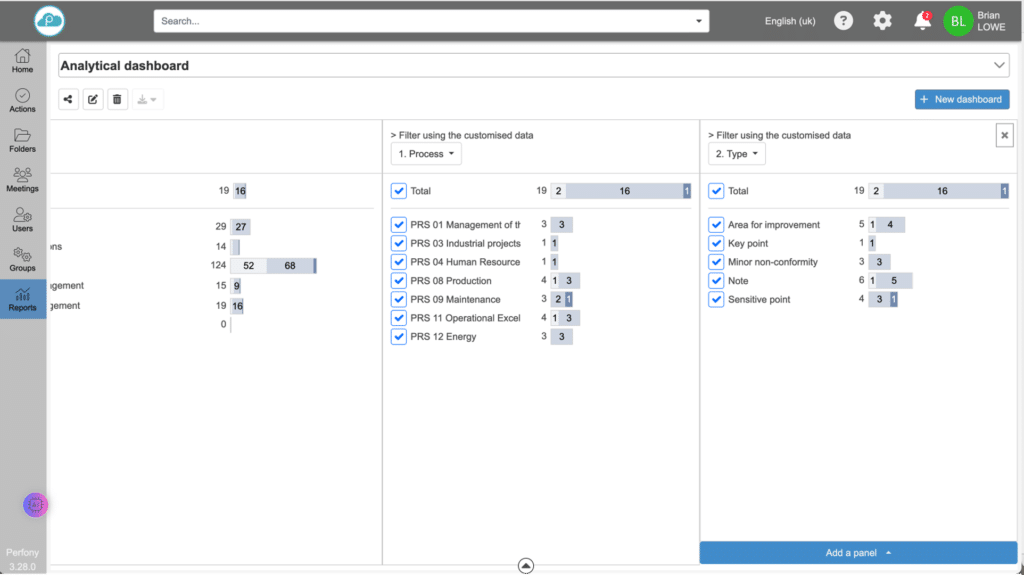
In the example below, we have selected the “Quality” folder, which shows us that it contains 19 actions. The first pane gives us the distribution of these 19 actions according to the values of the custom field “Process” and we add a second pane which gives us the distribution of the actions of the previous pane according to the values of the custom field “Type”:
